
Dynamic Data Comparison Tool
Turn Excel sheets into AI dashboards instantly. 100% Local.
Launched 2 weeks ago
1 comments
0 views
#Productivity
#Analytics
#Artificial Intelligence
About
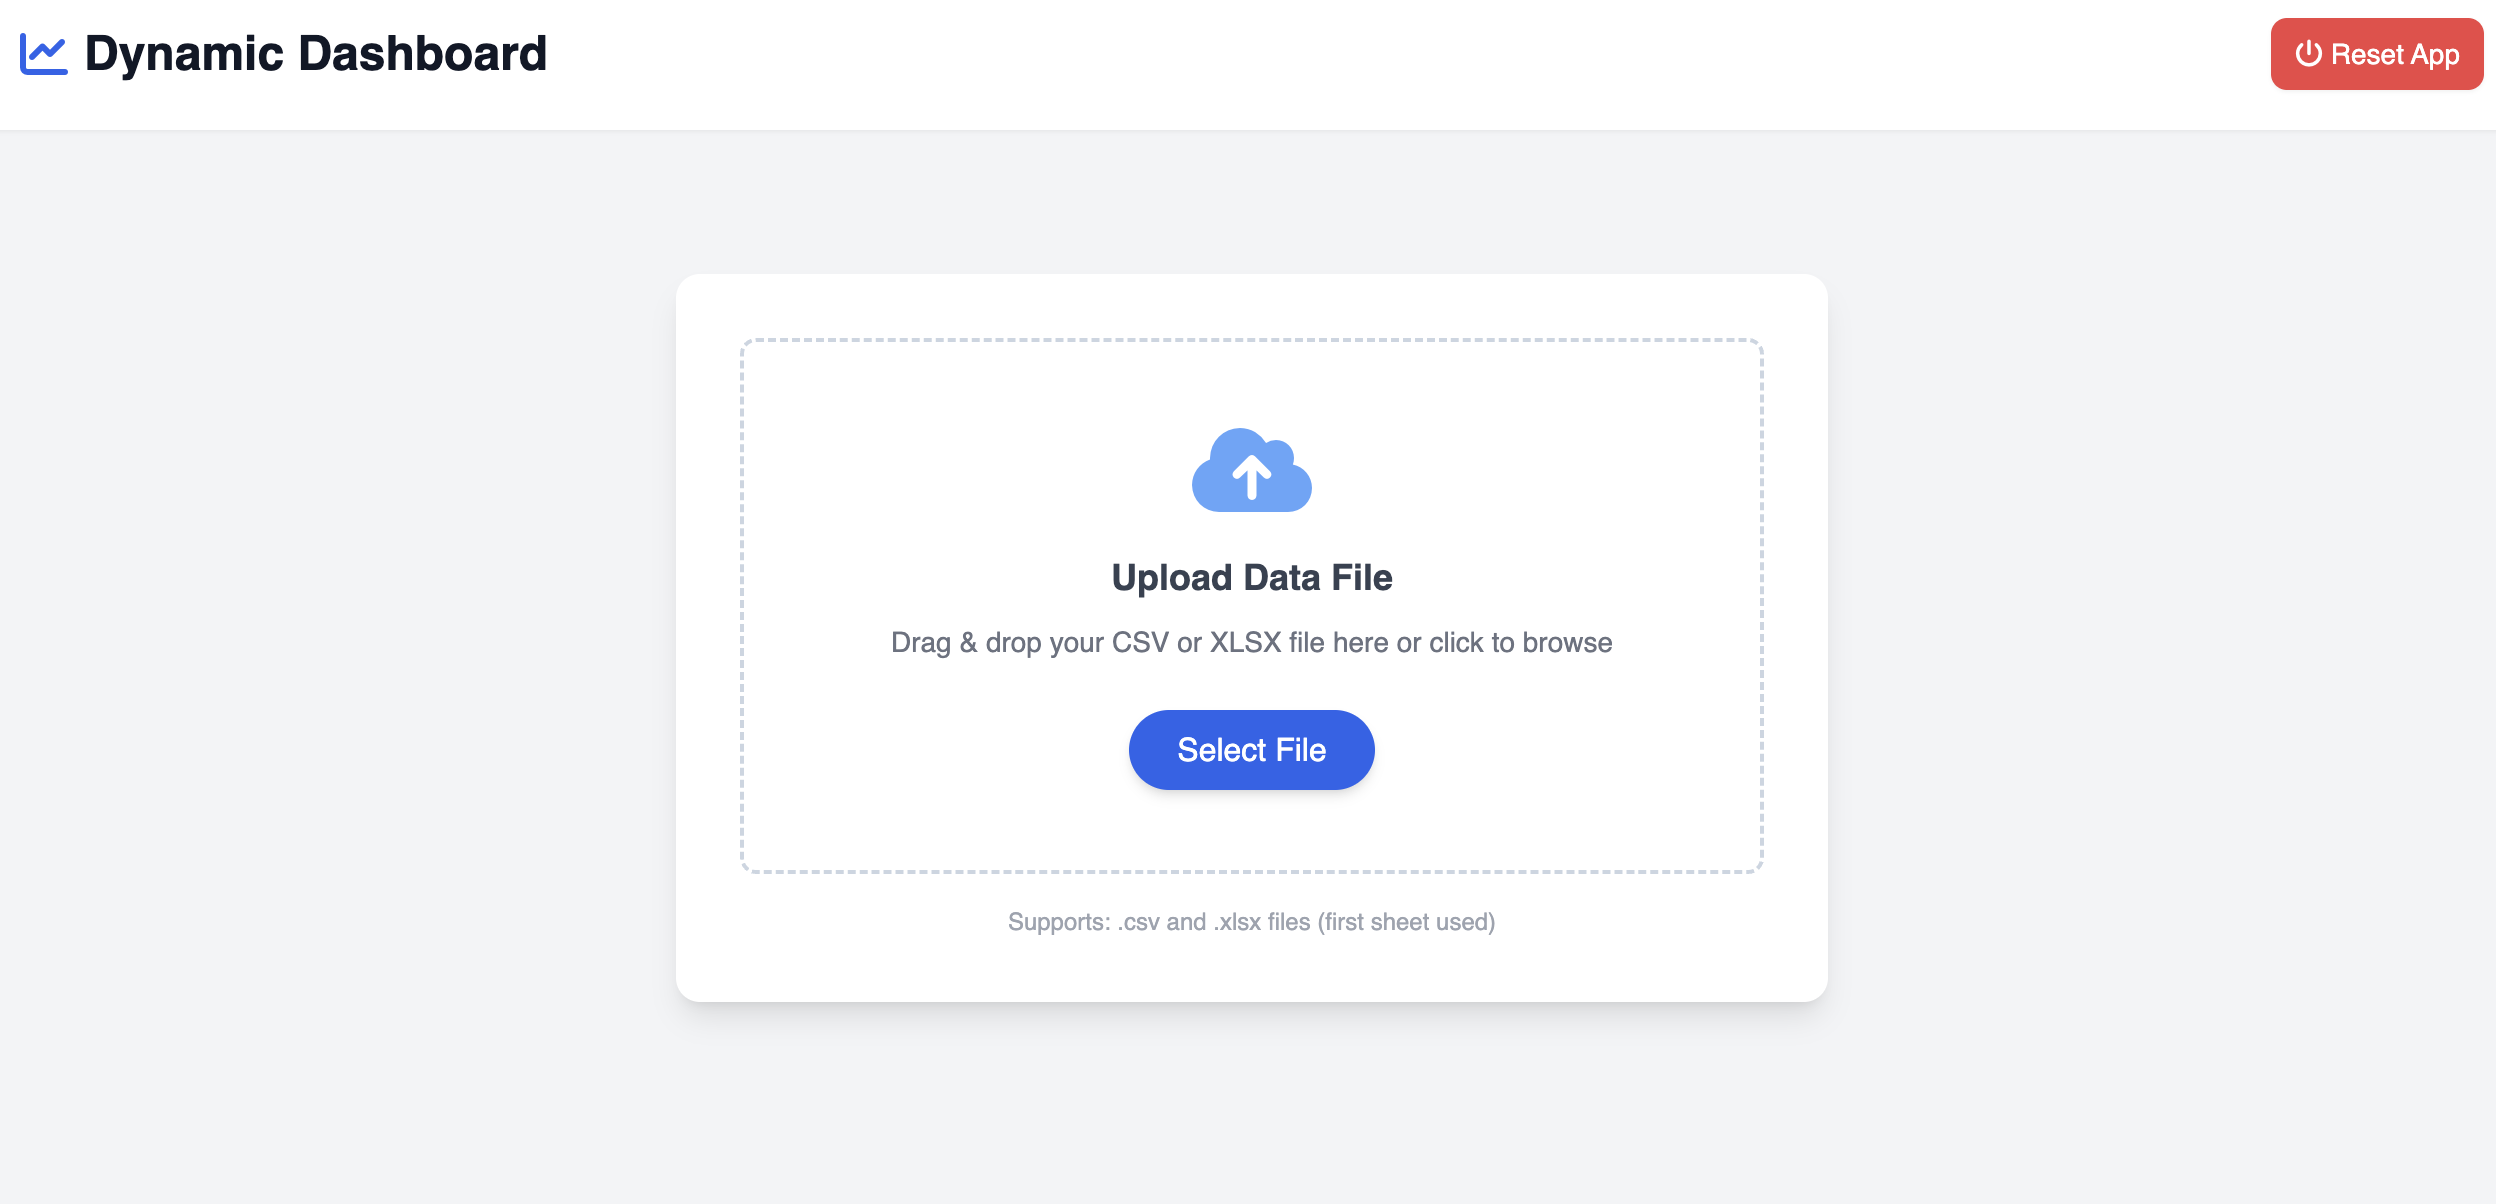
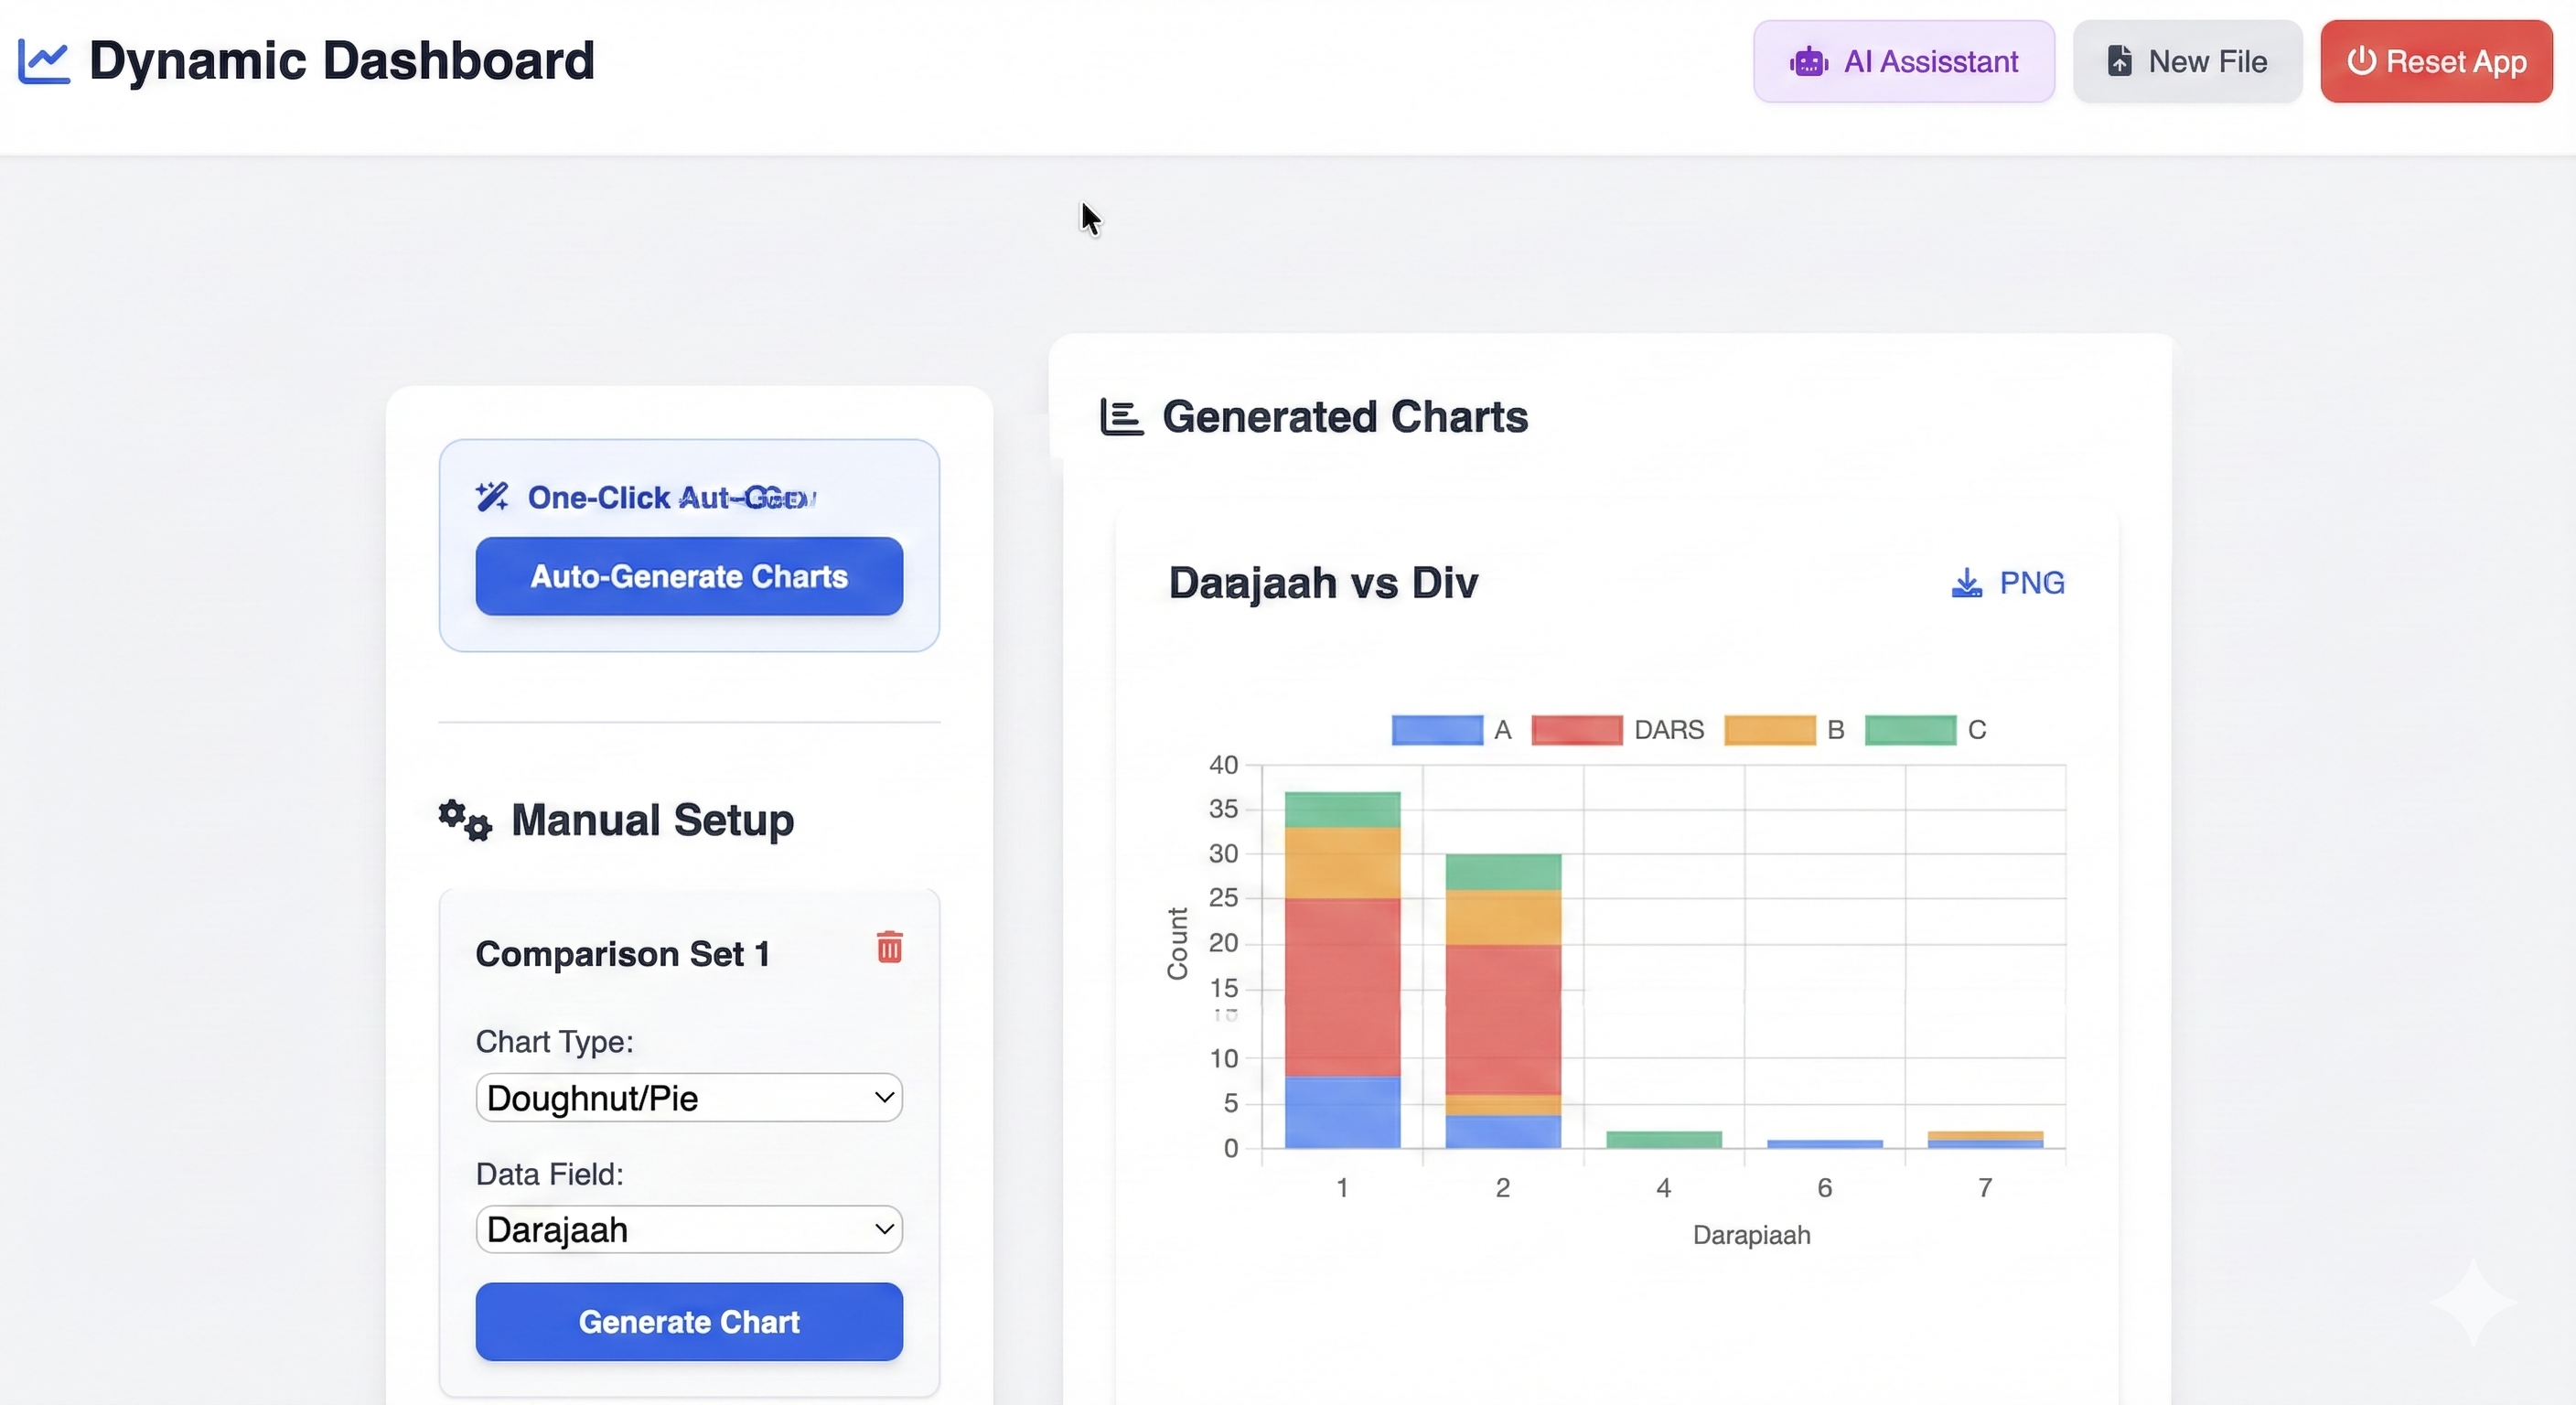
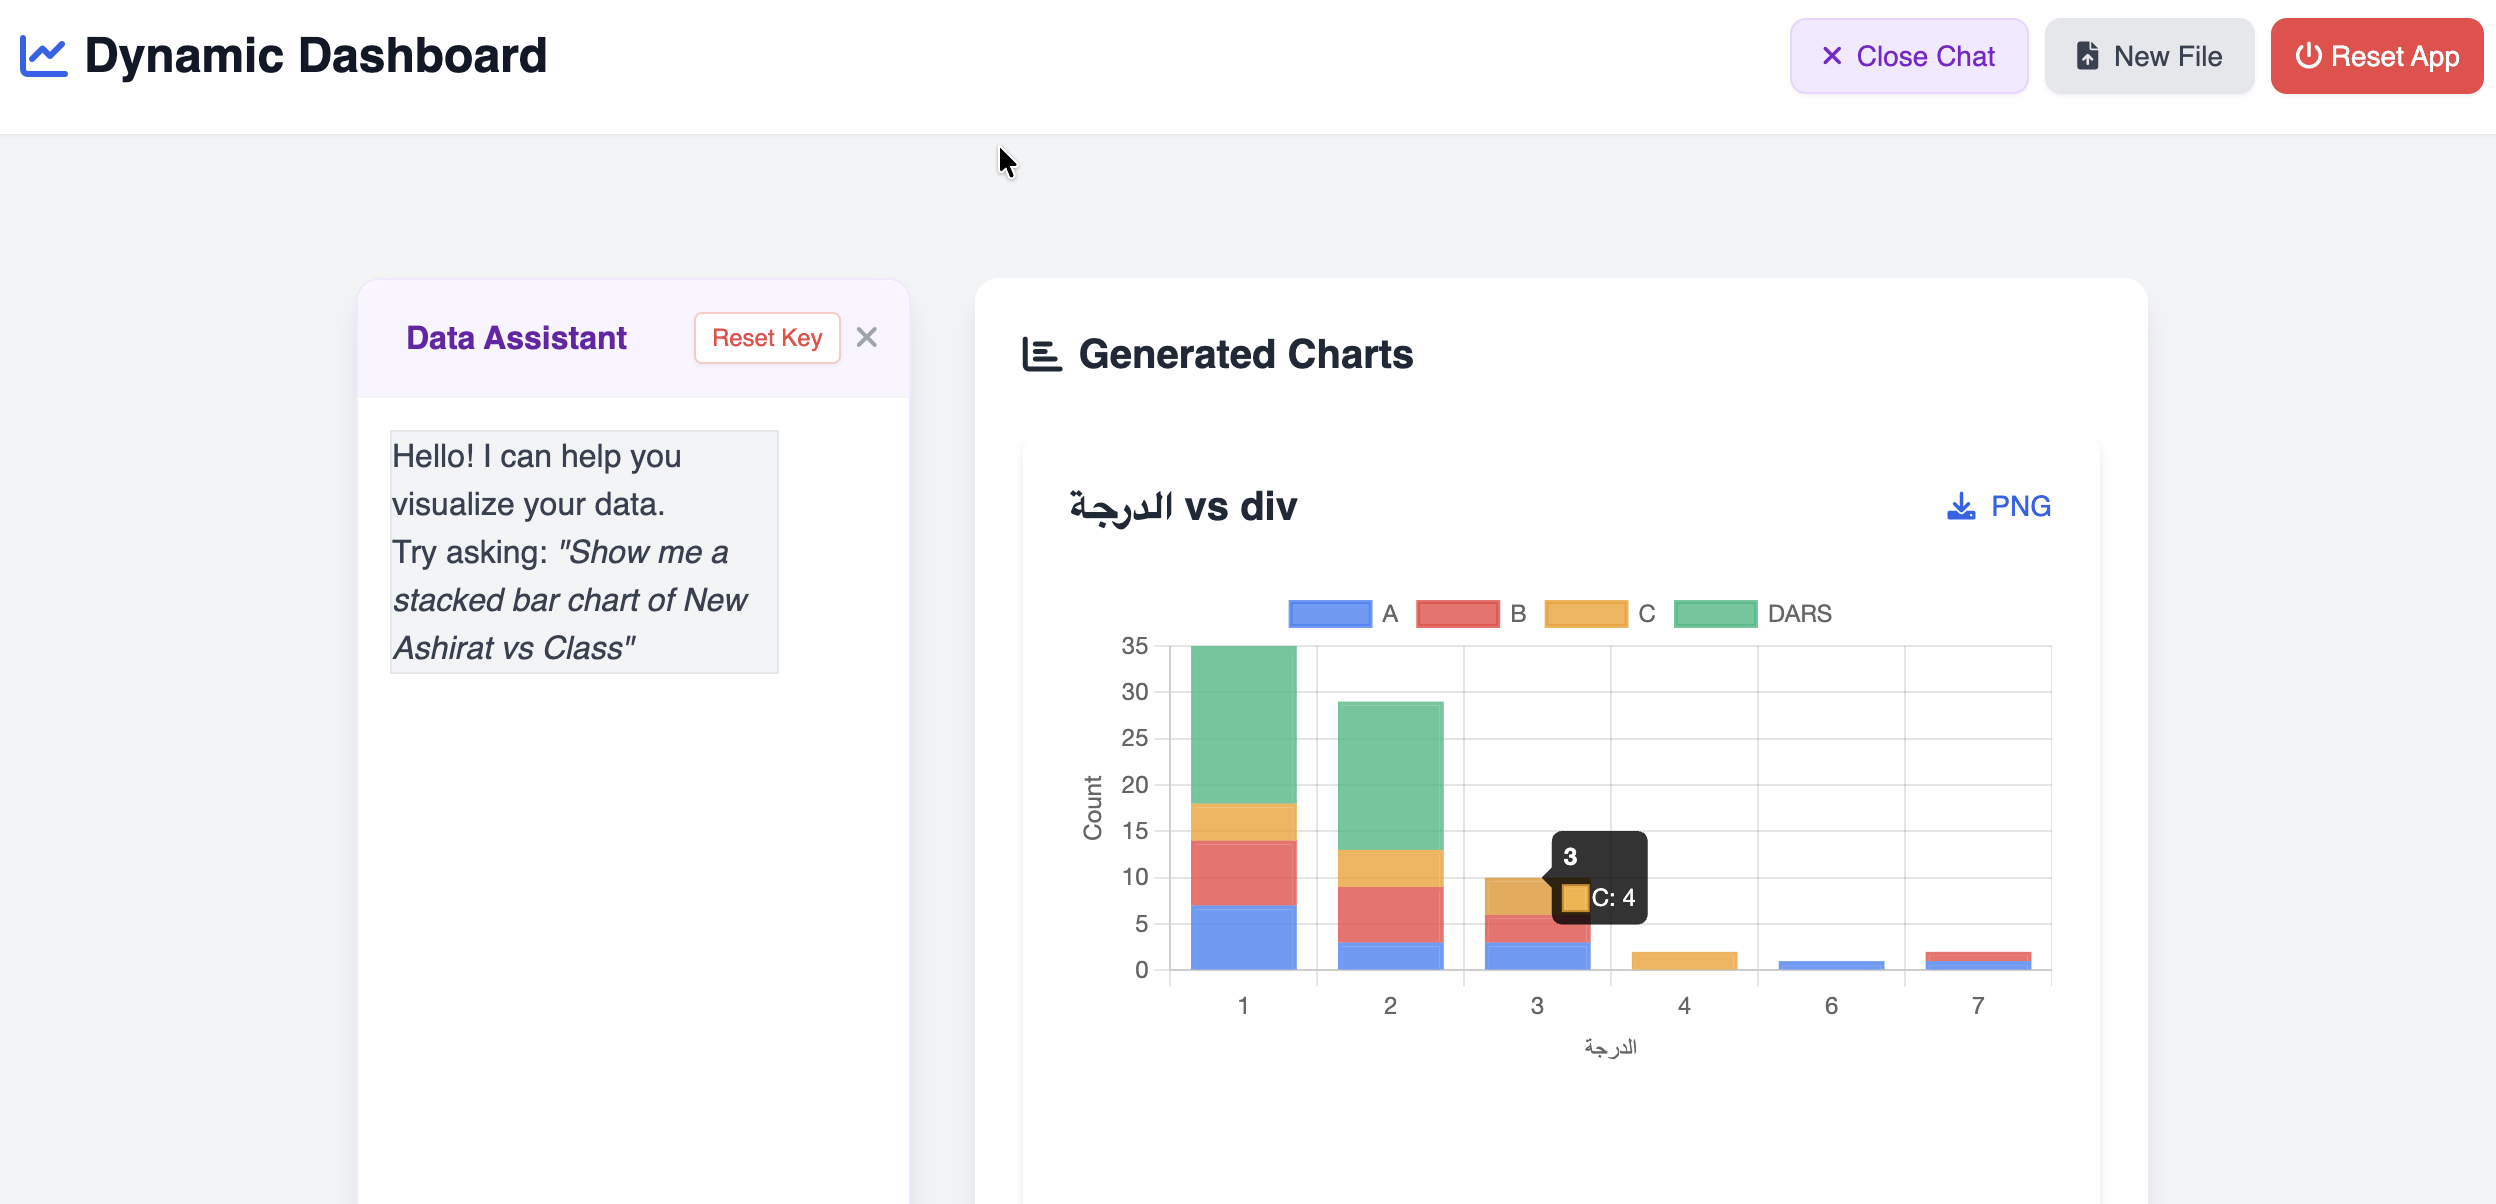
Stop manually building charts. This is a standalone HTML tool that instantly turns your Excel/CSV files into interactive dashboards. It runs 100% locally in your browser—no installation, no monthly fees, and your data never leaves your device. Features: 📊 Drag & Drop: Visualize sheets instantly. 🤖 AI Assistant: Ask questions like "Show me Sales vs Time" to auto-build charts. ⚡ Auto-Generate: One-click analysis. 🔒 Private: Zero server uploads.
Screenshots
Discussion (1)
Please log in to comment
[
[REDACTED]
Product Hunt
2 weeks ago
Hi Product Hunt! 👋
I built this because I was tired of how complicated it is just to get a simple chart out of an Excel sheet. I wanted something that was fast, private, and didn't require a monthly subscription.
This is a single HTML file. You download it, open it in Chrome/Edge, and it just works. It uses Google Gemini to let you "talk" to your data and build charts.
I'd love to hear what you think!
0
Maker
[
[REDACTED]
Related Products


Stats
Upvotes
0
Comments
1
Views
0
Launched
Nov 26, 2025